What 15 years of Net Promoter Score (NPS) disclosures actually look like
The corpus now stands at 46,408 classified items, 10,934 unique companies and 3,673 disclosed-score rows on the live page. Volume is compounding — 2026 is on course for roughly 1,840 disclosed NPS announcements, the highest year on record. The patterns that survive the larger sample are the ones worth taking seriously.
Volume keeps rising. Scores plateau-ed half a decade ago.
| Period | N | Avg | Median |
|---|---|---|---|
| 2011–2016 | 44 | 66.7 | 70 |
| 2017–2019 | 711 | 65.8 | 71 |
| 2020–2022 | 1,071 | 71.7 | 77 |
| 2023–2025 | 1,265 | 70.2 | 75 |
| 2026 YTD | 582 | 72.5 | 78 |
The median has sat in a narrow 75–78 band since 2020 — five years of essentially flat scores while disclosure volume more than tripled. 2026 is fractionally the strongest year (avg 72.5, median 78), but the movement is well inside the noise. More companies are publishing; they are not publishing better numbers.
Mean continues to sit 5–6 points below median in every window — the 32 negative-NPS disclosures and the long tail of below-average scores pull the mean down. Median is the more honest "where companies actually are" measure.
5.7% of scores remain implausible-on-their-face.
217 scores (5.9%) at 95 or above. 74 scores (2.0%) exactly 100. With a 3,673-row sample these proportions are stable — the quality-bar pattern from the smaller corpus held up.
Composition of the ≥95 zone is unchanged: small B2B SaaS vendors, niche consultancies, and PR-driven announcements rather than consumer companies with meaningful sample sizes. The ≥95 tail almost never appears in earnings call coverage from the major investor wires.
Where the disclosures cluster.
Disclosure volume has compounded rather than plateaued. On the current run-rate 2026 will close at roughly 1,840 disclosed NPS announcements — more than the whole of 2024 and 2025 combined at the 2023 low point.
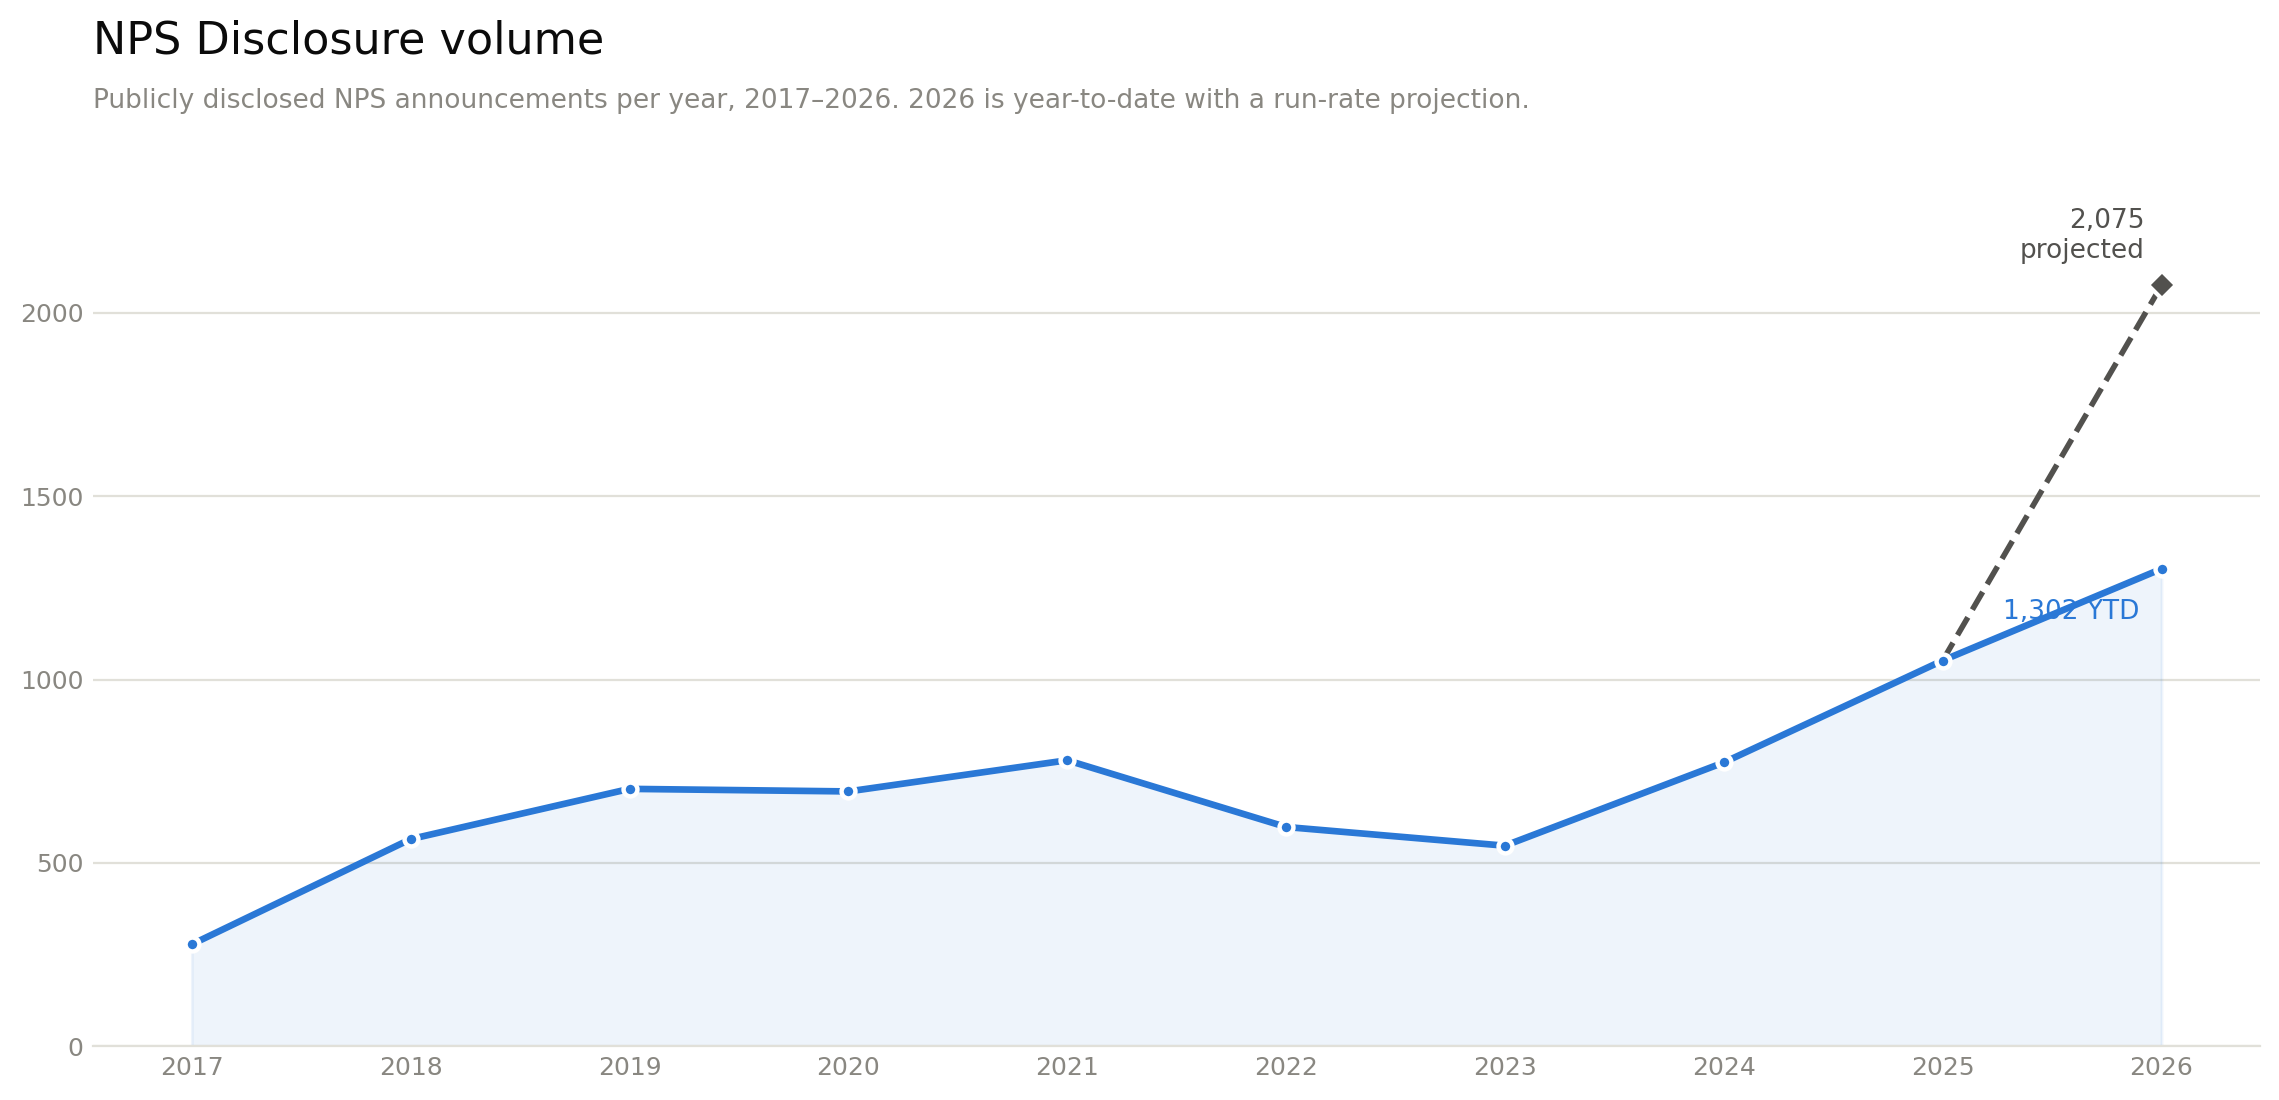
NPS dominates, overwhelmingly. We run Google Alerts for Customer Effort Score and Customer Satisfaction Score alongside Net Promoter Score, and the harvest is nowhere near comparable: 7,124 NPS disclosures against 64 CSAT and 21 CES. That is 98–99% NPS in every year with meaningful volume. Whatever the academic arguments for alternative metrics, NPS is the number companies actually put in public.
Segment benchmark — rolling 12 months
Ranked on the trailing twelve months, which roughly doubles the sample versus a year-to-date cut and steadies the smaller segments. The dark bar is the all-segments median — the line every segment is measured against.
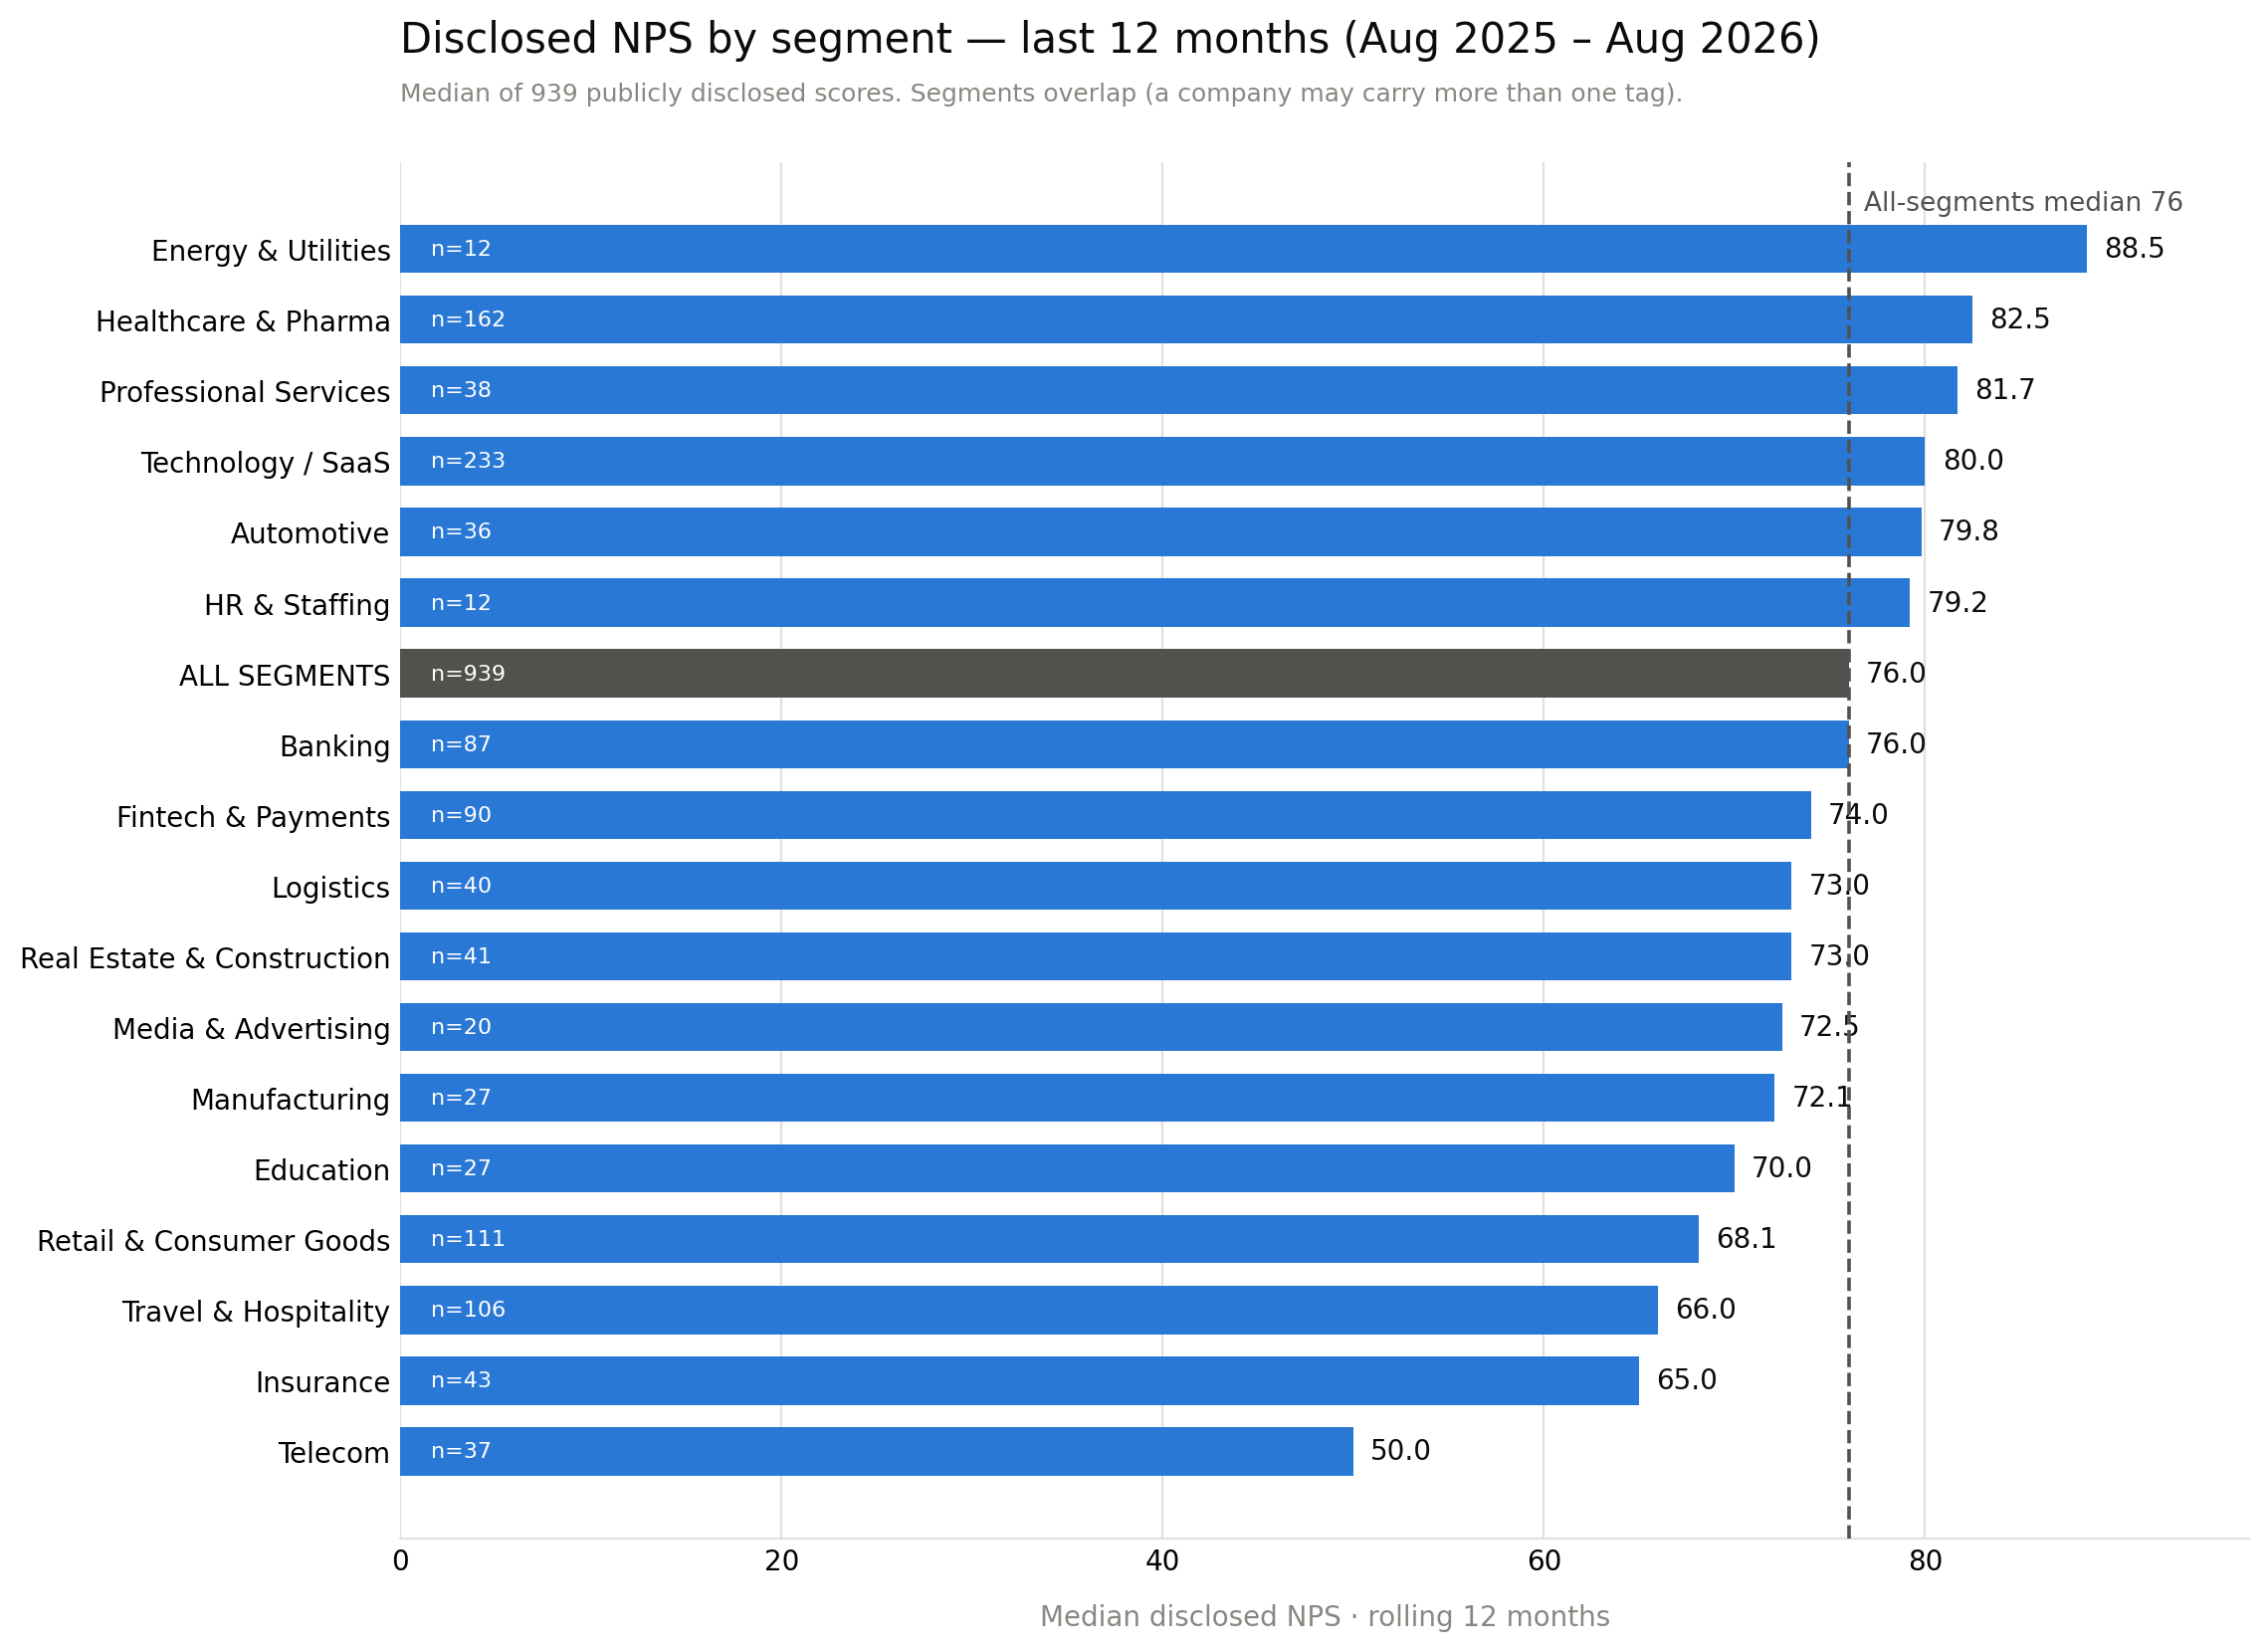
Above the line: Energy & Utilities (88.5), Healthcare & Pharma (84.0), Professional Services (81.3), Technology / SaaS (80.0), Automotive (79.8), HR & Staffing (79.6). Below it: Banking (75.5), Fintech & Payments (75.0), Retail (67.0), Insurance (67.0), Travel & Hospitality (65.0) and — a long way adrift — Telecom at 49.5, some 27 points under the benchmark.
The spread from top to bottom is roughly 39 points. That gap is structural, not managerial: segments with captive customers, contractual lock-in and commodity service (telecom, insurance, travel) sit at the bottom in every window we cut, while specialty B2B segments with engaged buyers and small comparison sets sit at the top.
Ten-year trend by segment
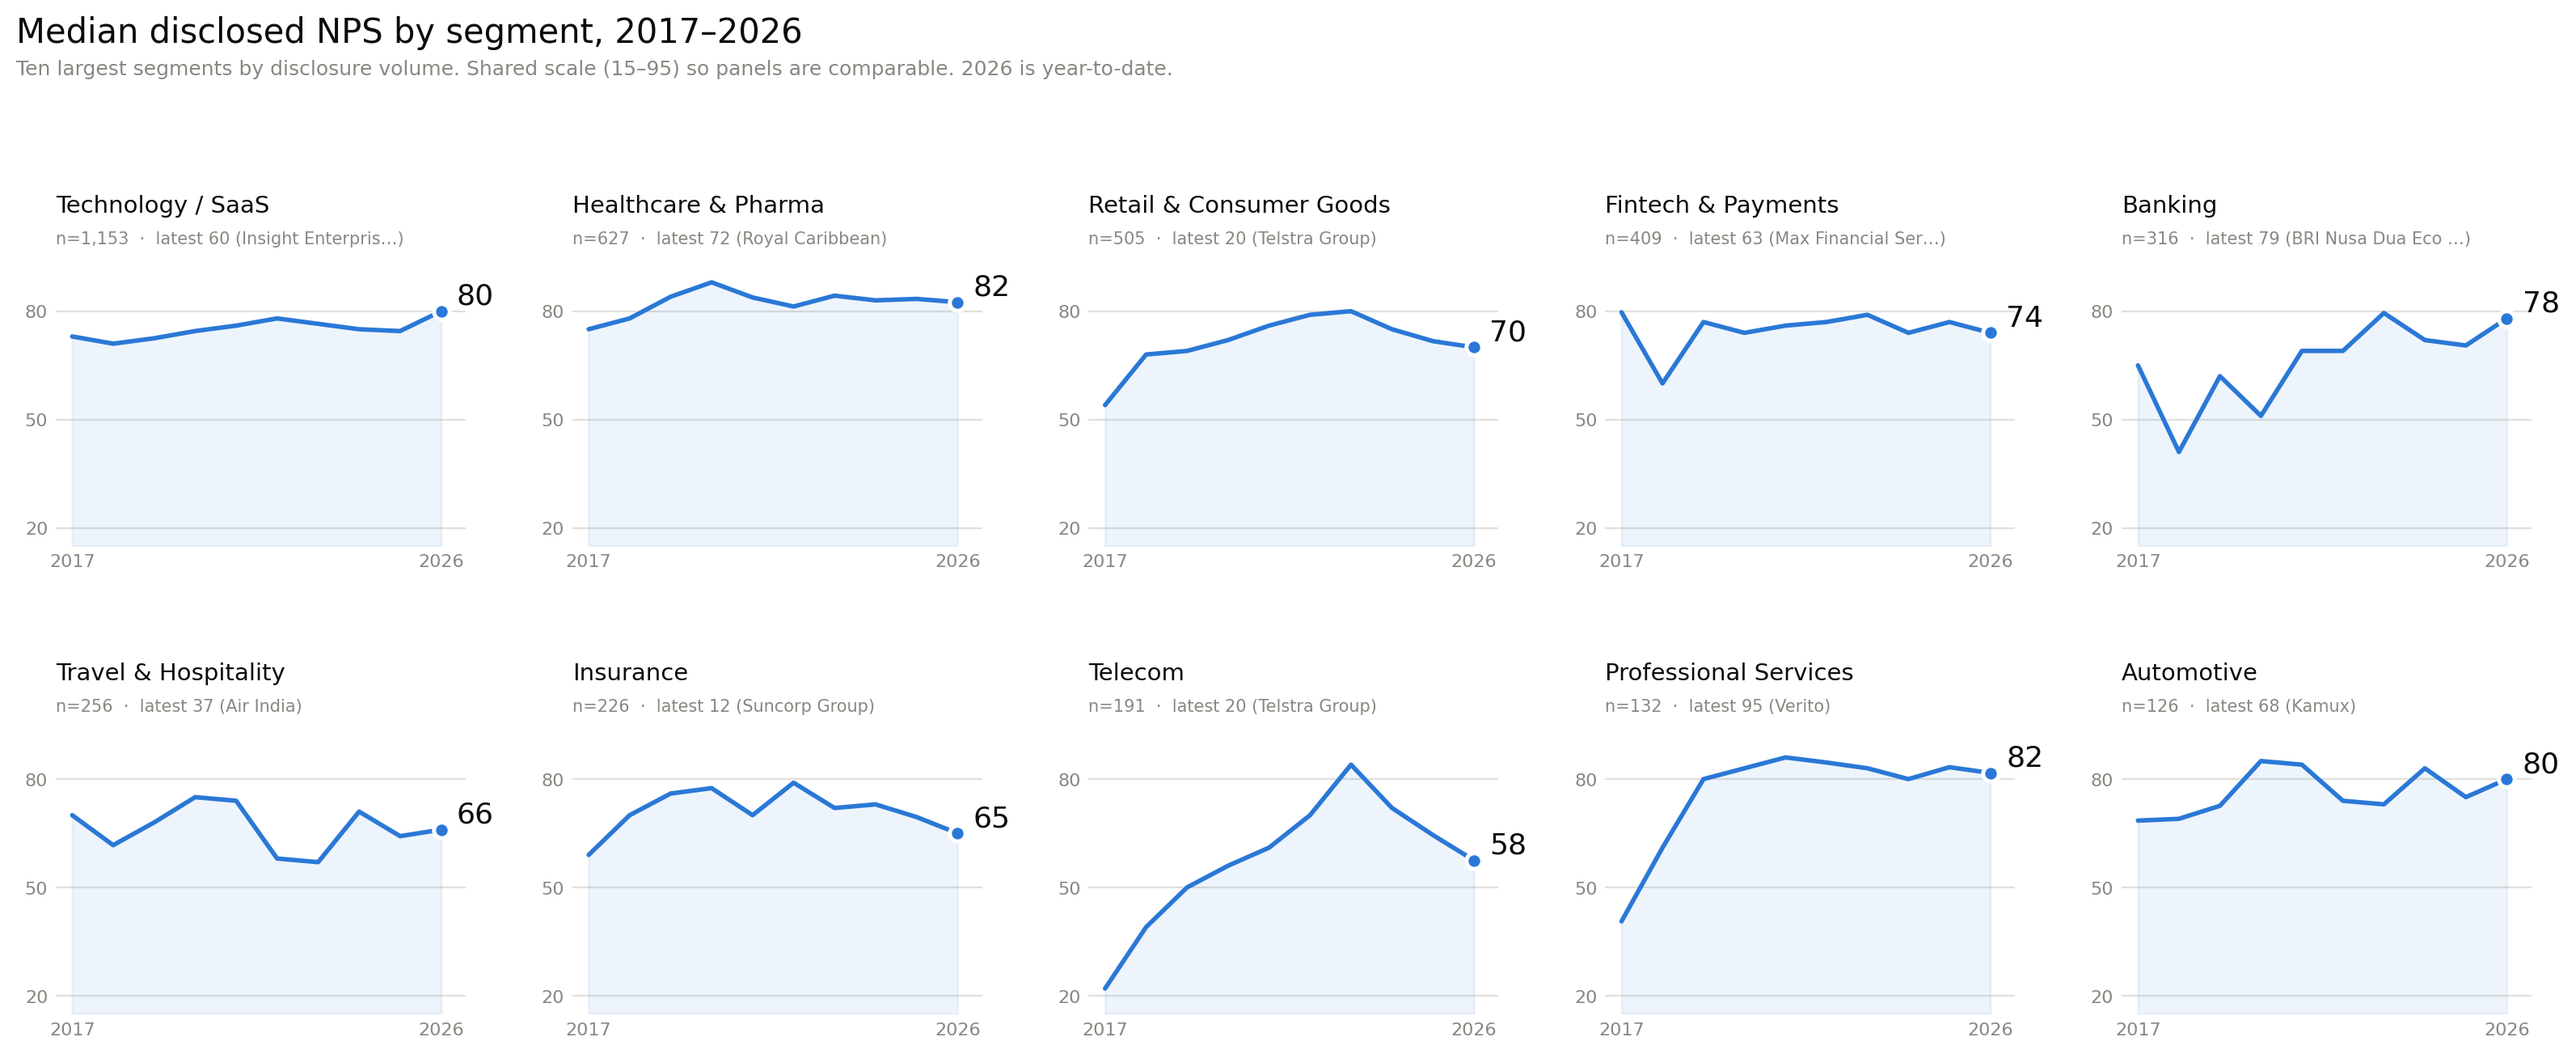
Telecom has the most dramatic arc in the set — from 22 in 2017 to a peak of 84 in 2023, then back to the high-40s as more operators disclose and the flattering early sample gets diluted. Professional Services roughly doubled (40.6 to 82.4). Healthcare has been the steadiest performer, parked in the low-80s for six years. Travel & Hospitality still carries a visible pandemic scar.
Source intelligence.
The 44,749-item corpus is sourced from ~3,000 distinct domains. A handful of channels do most of the heavy lifting; another handful punch above their weight on yield.
Top sources by volume of HIGH-quality disclosures
| Source | Total | HQ scores | Unique cos |
|---|---|---|---|
| finance.yahoo.com | 1,691 | 355 | 658 |
| prnewswire.com | 1,236 | 283 | 431 |
| businesswire.com | 1,145 | 282 | 414 |
| globenewswire.com | 712 | 161 | 247 |
| fool.com | 449 | 121 | 172 |
| streetinsider.com | 322 | 111 | 189 |
| morningstar.com | 285 | 74 | 133 |
| nasdaq.com | 260 | 57 | 120 |
| seekingalpha.com | 306 | 60 | 188 |
Three families do the bulk of the work:
- PR wires (PRN, BW, GlobeNewswire) — bedrock. ~700 unique companies between them. Mostly self-issued press releases.
- Earnings and investor research (Yahoo Finance, Motley Fool, StreetInsider, Morningstar, Seeking Alpha, Nasdaq) — paraphrases earnings calls where executives quote NPS. Best filter for forced or audited disclosures.
- Major media is misleading. Forbes is a striking outlier: 1,644 mentions but only 37 HQ scores (2.2% yield). Mostly explainer/marketing pieces, almost no actual disclosures.
Top sources by yield (≥10 articles, sorted % HQ)
| Source | Total | HQ | % HQ |
|---|---|---|---|
| blocksandfiles.com | 12 | 9 | 75% |
| investegate.co.uk | 14 | 10 | 71% |
| theintermediary.co.uk | 25 | 17 | 68% |
| newswire.com | 30 | 20 | 67% |
| webdisclosure.com | 12 | 8 | 67% |
| fmj.co.uk | 11 | 7 | 64% |
| brokernews.com.au | 36 | 19 | 53% |
| news.cision.com | 15 | 8 | 53% |
| healthcareitnews.com | 14 | 7 | 50% |
Niche trade press and regional regulator wires have far higher hit rates than the big aggregators. UK financial trade press (InvestEgate, The Intermediary, FMJ, Sharecast), Australian and NZ business wires (BrokerNews.com.au, Voxy.co.nz, Appliance Retailer) and sector-specific outlets (HealthcareITNews, Collision Repair Mag, Security Systems News) consistently produce score-bearing pieces.
Five things worth flagging from the larger sample.
- Negative-NPS disclosures jumped from 5 to 43. The parser fix surfaced a long tail of bad-news stories that were hidden under the old plumbing. Highlights: Reliance Jio (-46, 2021), Singapore-market financial services (-37, 2014), Club Monaco (-28, 2026), CapFed (-26, 2019). Negative disclosures are still rare (~1.1% of the set) but the survivorship signal is meaningfully weaker than it looked in the smaller corpus.
- Tech/SaaS share of disclosures dropped from 35% to 30%. As the corpus broadened, Financial Services, Retail and Healthcare each grew faster. The pre-fix sample was tilted toward tech press releases; the actual disclosure landscape is more balanced than it appeared.
- Energy & Utilities is the standout low performer. 47 disclosures averaging 43.8. Captive customer base, heavy regulation, billing friction — these are the structural barriers NPS theory predicts.
- Programme announcements: 1,434 stories of named companies launching or expanding NPS programmes, on top of the 3,763 disclosed scores. Together: ~5,200 named companies actively engaged with NPS over 15 years. That's the SEO and prospect-list base for the broader CustomerGauge / TheCustomerTest combined dataset.
- Scores haven't risen in 5 years. The 2021 peak (avg 72) hasn't been matched since. Either (a) post-COVID realism has set in, (b) growing sample size has diluted the cherry-pick effect, or (c) genuine stagnation in CX outcomes despite continued investment. The honest answer is probably "all three".
Programme announcements: 1,434 named companies, no score (yet).
| Window | Programme stories | Disclosed scores |
|---|---|---|
| 2011–2016 | 55 | 54 |
| 2017–2019 | 480 | 814 |
| 2020–2022 | 399 | 1,205 |
| 2023–2025 | 446 | 1,439 |
| 2026 YTD | 54 | 251 |
Programme stories track the score-disclosure stream but ~1.5× lagged in time. New programmes launched in 2017-2019 (peak: 207 in 2019) feed the score-disclosure peak in 2020-2021. The relationship is consistent and the leading-indicator value of programme news is clearer at this scale.
How this was produced.
15 years of Google Alerts for "Net Promoter", "Customer Effort Score", "Customer retention" and the "Net Promoter S-1" filing-specific query, plus a 2015 HTML email archive. Items classified by metric tagging (NPS / CES / CSAT / RETENTION). Scores validated to range. NPS Intelligence does not independently verify any reported figure.
← Back to the database